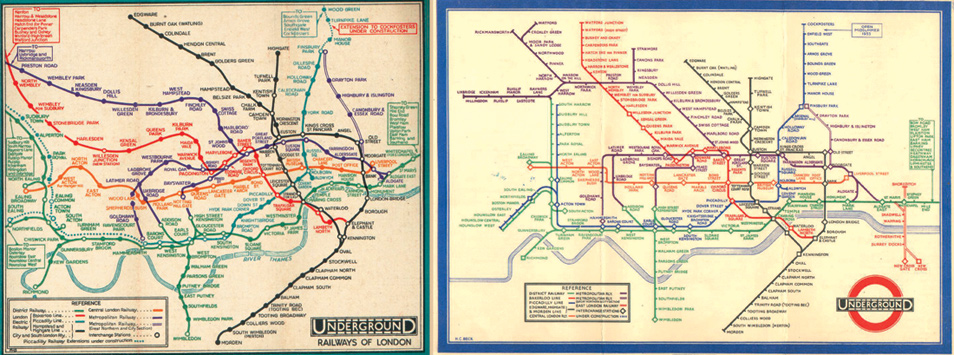
Last week I attended a lecture entirely about underground diagrammatic maps! (one of my first loves) In the lecture, the London Underground diagram (LUD) was presented as the case study to unravel various information design and cognitive principles. Created back in 1933 by Henry Beck, the LUD is currently considered an iconic (information) design piece and the key project of the diagrammatic map typology.
Before Beck’s LUD, underground maps presented their networks geographically by overlapping transport routes on geographic city maps. In 1933, Beck redesigned the London Underground map as a diagram by presenting a schematisation of the map of London city. The LUD, as other diagrams, transforms accurate geographical features into a geometrical and simplify graphic language. Gradually, this diagrammatic language has been adopted to represent information not related to transport systems. However not all information conveyed using a diagrammatic language achieves the same degree of efficacy and usability as the very first LUD (more current versions of the LUD seem to challenge users’ understanding – to be discussed in a different post). Max Roberts’ s work is concerned with exploring the usability and understanding of diagrammatic maps, e.g. LUD, to identify principles to help improve the development of this information design (ID) typology. He has studied the original task of underground diagrammatic maps (i.e. how to go from A to B using the underground system) and investigated why in some diagrams that task seems to be more difficult to understand than in others.
The relevance of cognitive load for ID
Cognitive studies are essential to evaluate the effectiveness of information seeking and information processing tasks, such as the ones involved in information design solutions. Cognition refers to the mental processes people go through when dealing with almost any task from understanding a text, solving a problem, making decisions, learning, reasoning, and remembering a telephone number to paying attention in a class.
The information elements and their interactions that need to be processed at the same time than gaining knowledge are described as cognitive load. During complex learning tasks, the amount of those elements (information and interactions) ”˜can either under-load or overload the finite amount of working memory’ people have. When that happens, people are more likely to have problems to learn or understand information, as those elements need to be fully processed to move forwards within the learning cycle. For example, learning tasks that don’t demand much processing load may need to increase the load with practical tasks to challenge people’s learning skills, while other learning activities, e.g. complex tasks, demand high processing load, needing to reduce the load to help people not feel overwhelmed during the learning process.
Particularly, information design solutions that display more information than the necessary force the user to allocate extra energy (e.g. time, resources, effort) to make sense of that information. Therefore, the effectiveness of the user’s understanding process decreases and confusion is more likely to happen. In other words, when that problem arises, that information design solution needs to be revised.
”˜Information pollution’
Similar to Bertin’s Graphic density, Roberts uses the term ”˜information pollution’ to describe displayed information on underground diagrams which does not add any new values, but instead ”˜raises [users’] cognitive load’, and causes users’ ”˜attention capture to detract from the main task’ (e.g. how to go from A to B). When unnecessary information is visualised, users need to invest (extra) energy to ignore and filter that information, raising cognitive load.
How to avoid raising cognitive load on ID?
Cognitive load is often measured through subjective studies (e.g. qualitative methods), performance measures (e.g. quantitative methods), and psychophysiological measures. As part of a research project, Roberts et al.(2013) used a combined methodology of objective usability studies (i.e. station and interchange finding, journey planning), subjective measures (i.e. usability rating, map preference), and design experiments (i.e. altering design rules) to test the usability and effectiveness of the LUD and other underground diagrammatic maps. As a result, he identified six principles of map design that, to some extent, could be transferred to other information design solutions or be useful for visualising information:
- Simplicity: Systematic reduction of the information to be conveyed
- Coherence: Defined shape and structure
- Balance: Clear definition of focal points and appropriate graphic density
- Harmony: Visual refinement
- Topography (Credibility): Low conflict with expectations
- Supplementary information: Low quantity, high quality
When those principles are not taking into account the designer is interfering with the main task of the solution they are creating, therefore, increasing the risk of producing unintelligible outcomes. However, not for merely implementing design principles, effective usability would be 100% achieved, as they also have to be well-interpreted and applied. Information designers should have the necessary set of skills to make the best use of those principles.
Other important findings of Roberts’ study are:
- Usability is not the same than likeability. In other words, liking an infographic or diagram does not guarantee that it will be useable (or useful for the intended user). Before a design solution is actually implemented within its context of use and intended user, its usability success shouldn’t be claimed.
- We are all novice users at the beginning. When ‘something’ is evaluated for the first time, all users should be considered as novices, and thus are most likely to find the understanding of a task or diagram, or the implementation of a new tool highly difficult. What needs to be measured is the amount of time that the user takes to understand the diagram or learn how to use a tool.
——
NB: This post is based on the lecture: Roberts, M. (Feb, 2013) Underground Maps Unravelled [Lecture] Design Museum, London
More results and findings on:
– Roberts, M.; Newton, E.J.; Lagattolla, F.D, Hughes, S. and Hasler, M.C. (2013) Objective versus subjective measures of Paris Metro map usability: Investigating traditional octolinear versus all-curves schematics. Human-Computer Studies, 71 (2013) 363–386
Leave a Reply