Information design is not only about visualising data or information. As written elsewhere, information design is about sensemaking. Sensemaking has been defined and studied by many authors. Most well-known theories and models are the works by Russell et al. (1993), Klein et al., (2007), and Pirolli and Card (2005). All describe the process as active, purposely and complex, involving several stages, activities and actions in which we integrate what we already know about a situation with incoming information. This post describes the sensemaking process of information design by providing an overview of key cognitive sensemaking activities introduced in prior studies and explaining how they influence the development of effective solutions.
Cognitive sensemaking activities
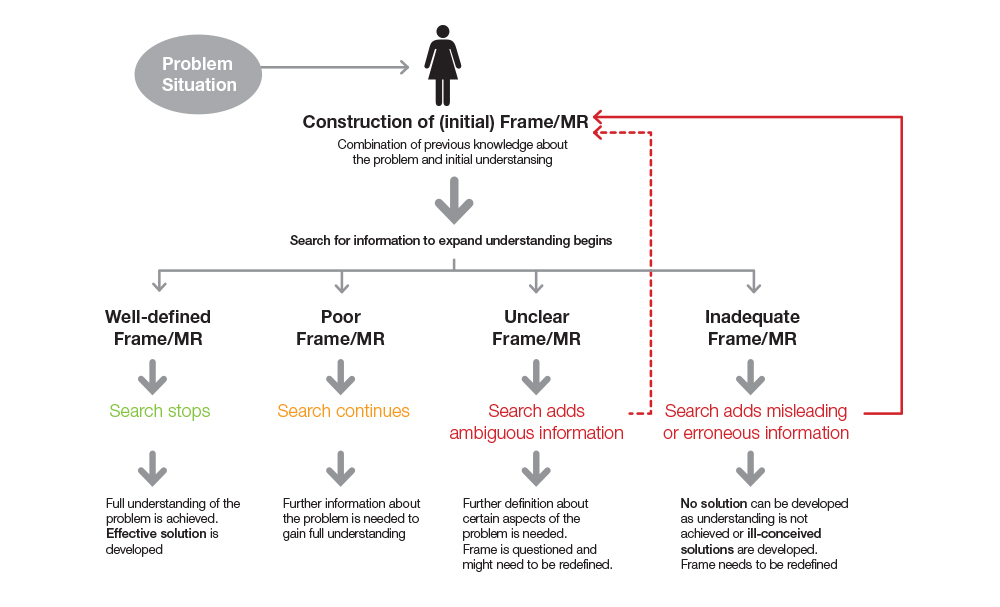
Klein et al.’s (2007) theory is relevant to shed light on the information design process and how information designers make sense of problem situations. This sensemaking theory describes cognitive sensemaking activities and mental representations, which are referred to as Frames as key components of the process. Mental representations (MR) or Frames are structures (e.g. maps, stories) we create to determine the components of a situation and then use to guide our learning process. In other words, through the creation of these mental representations (frames) we unravel problems and establish which components we need to focus on first to expand our understanding, and then can identify what further data we need in order to make sense of each of those component. In addition, MR or frames help us filter incoming information (e.g. distinguish relevant from irrelevant information) and organise new knowledge. The filtering process allows us to select three or four anchors to construct initial understanding to be able to move to the next step. An anchor is a data component and minimal unit of our frame. The process of constructing frames, and the selection of data and anchors occur in simultaneous, no one comes first (like the egg and the chicken). As new information becomes available we construct and expand our understanding (of a particular situation) and therefore the initial frame keeps evolving until we find a solution. In some cases if the frame is unclear we can question the frame or elaborate on it if it poor by adding more anchors or changing initial ones. When our initial frame is inadequate or misleading, we are unable to find a solution because we either have not collected relevant information for that particular problem or have not achieved enough understanding. In this case, we have to reframe our initial frame; that is to create a new mental representation. Sometimes this can mean to start the process again or go some steps backwards.
Applying Frames to Information Design
At the beginning of a problem situation, information designers construct an initial mental representation based on how much or how little they know about that situation (i.e. construct a frame). This mental representation lets them start working acting as a guide of which further information they need to collect or learn about. At the same time, to create the mental representation, they have to decompose the problem into smaller components (i.e. anchors). This step lets them identify which aspects of the problem (i.e. gaps of knowledge) need further clarification and what types of data are needed to fill those gaps (e.g. new face-to-face meeting with client, phone call, email communication, further research and exploration).
The role of expertise. More experienced information designers draw upon their previous experiences to construct the initial mental representation and identify what types of data they need for each situation. Novices require longer periods of time to come up with an appropriate first mental representation, and therefore to know how and where to start constructing the relevant understanding. Although both can make the same mistake of ignoring indicators of ill-defined initial MRs, novice designers may not be able to identify those indicators until the very end of the process having to start all over again. However expert designers have developed the skills to detect inconsistencies or gaps during the process, and stop to redefine the initial MR and redirect the process towards the development of an effective solution. Sensemaking situations & Problems. Information designers make sense ofa varied range of scenarios and situations, including:
- “Problem detection: e.g. To determine if a pattern was worth worrying about and monitoring more closely (e.g. weather forecasts)
- Connecting the dots: e.g. To understand an ill-defined situation and make discoveries
- Forming explanations: e.g. To figure out how a device works
- Anticipatory thinking: e.g. To prevent potential accidents or problems
- Projecting future states: e.g. To be fully prepared
- Finding the levers: e.g. To figure out how to think and act in a situation
- Seeing relationships: e.g. To see a map to find where we are or to find our way out
- Problem identification: To identify variables in a problem to define a solution strategy.” (Klein et al., 2007)
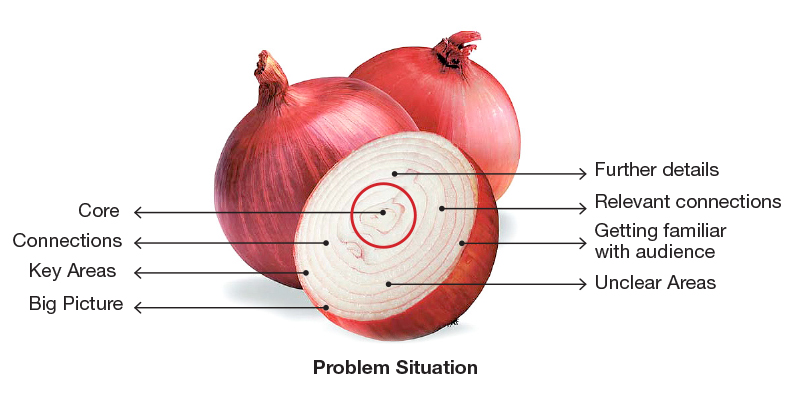
It is worth mentioning that the use of visual language, graphic design or the creation of visualisations as the end goals are not implicit solutions for the above information design situations. Even though visual representations (e.g. diagrams, sketches, drawings) are often used to support and aid the sensemaking process, information design does not necessarily involved solutions in the form of visual outcomes (e.g. visualisations, animations, information graphics). To make sense of a problem situation, information designers need to start peeling off layers until the hidden structure and core elements are unravelled and full understanding is reached. Only then, they will start thinking about the development of an adequate solution. The creation of visualisations, maps, wayfinding systems, information graphics, animations constitutes a later step in the process. — – Klein, G., Phillips, J. K., Rall, E. L. & Peluso, D. A. (2007) A Data-Frame Theory of Sensemaking. In Expertise Out of Context: Proceedings of the Sixth International Conference on Naturalistic Decision Making (Expertise: Research and Applications Series) (Pensacola Beach, Florida, May 15-17, 2003). Mahwah, NJ: Lawrence Erlbaum Associates, 113-155. – Pirolli, P., & Card, S. (2005). The sensemaking process and leverage points for analyst technology as identified through cognitive task analysis. Proceedings from Proceedings of International Conference on Intelligence Analysis. – Russell, D. M., Stefik, M. J., Pirolli, P., & Card, S. K. (1993). The cost structure of sensemaking. Proceedings from Proceedings of the INTERACT’93 and CHI’93 conference on Human factors in computing systems, Amsterdam, The Netherlands
Leave a Reply