What do a grilled cheese sandwich and information design have in common?
Both are activities that involve the practice of organising information (or ingredients!), simplifying complexity and, also very important, having fun! “How to make a grilled cheese sandwich” is a simple exercise to introduce (design and non-design) students to information design key principles that I often use in my classes and workshops. The exercise does not require advanced software knowledge skills or any technological device, just colour markers, sets of small and large pieces of papers, big tables and a room with walls. The brief of the exercise is described below:
Exercise:
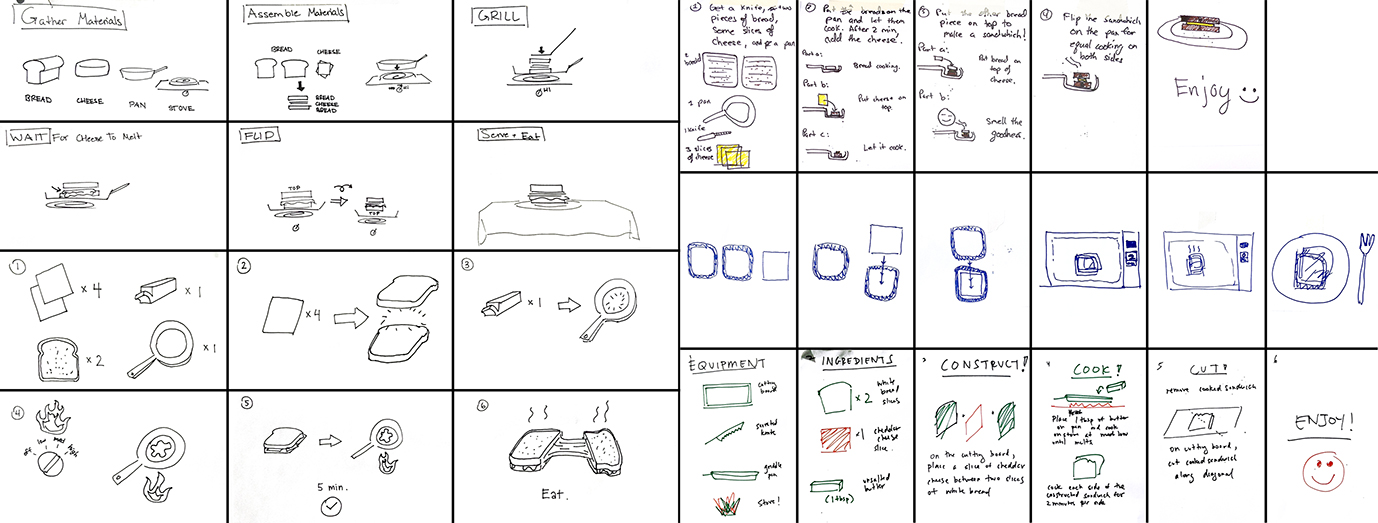
How to make a grilled cheese sandwich? [a peanut butter and jelly sandwich also works]
Working individually, visually explain the process of making a grilled cheese sandwich in a maximum of 6 steps. For that:
- Draw each step in a different piece of paper – No words at this point! [Each student is given 6 A5 pieces of paper]
- Place the 6 A5 pieces in sequential order on a larger piece of paper [Each students is given a flip chart sheet of paper or a piece of brown paper]. Underneath each A5 piece of paper, write one word summarising the core idea of each step.
- Add details to each step, e.g. key words, descriptions, name of ingredients, context, timeframes, etc.
- Look for connections between the steps, the key words, and the additional information.
The above steps should be briefed one at the time to let students focus on the specific task of each step. Allocating timeframes to each step also helps students be more focused and engaged. However, if students are given too much time per step, they try to create pretty drawings or refine them, rather than only focus on the cognitive task at hand. For example, 10 minutes per step tend to work well.
Group Analysis
After the individual part of the exercise is finalised, the second part focuses on analysing, as a group, the different processes that each of the students have identified and the various ways in which the processes were visualised. Because the process of making a grilled cheese sandwich is not a particularly hard process, broadly, all students identify more or less similar core steps: e.g. select cheese, put cheese on bread, heat bread with cheese, eat. However some variations also emerge to the point that, so far, not two students have identified the exact same combination of steps, same set of ingredients or have visualised two steps in a same way.
During group analysis these findings become evident as students compare all processes, looking for commonalities and differences. This analysis leads to identify the core steps of the process””those that, in some form, have been described by everyone””and also unexpected steps””those only considered by a few. Understanding why each student chooses some steps over others helps the group start getting familiar with the ingredients of the decision making process and exploring the simplification process (i.e. distinguishing main from secondary information). This part of the analysis gives students a window into each other’s way of thinking. They realise that each person tends to have a different thinking process, but also that different processes can lead to similar results. This briefly touches on conceptual design.
Furthermore, students also analyse how each of them has dealt with the visual representation of reality and of a process. During the first part of the exercise, students explore how to visually communicate 1) a sequence of events or tasks, and 2) concepts and ideas in a way that should be understood by others, and, at the same time they practice how to synthesize meaning with one word. This tackles the concept of visual thinking.
Group Coding
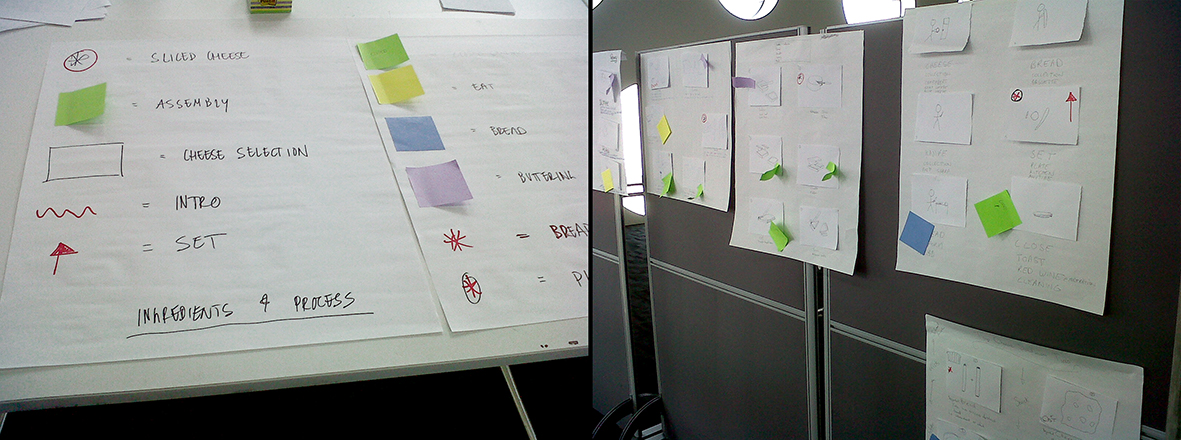
To structure the analysis, students learn how to use graphic elements (e.g. lines, colours, arrows, geometric shapes) to indicate similarities and differences, distinguish categories or types of information, show connections, visualise flows, and emphasise key information. Students create a key for the coded information, transcribing the graphic elements used and a short description into a new sheet of paper. This helps students start getting familiar with the concept of coding information.
Exercises like “How to make a grilled cheese sandwich?” help students start exploring a different way of thinking: reduce something to its core essence (identify and extract meaning), communicate something (a sequence of events) with a different language (visual thinking), and distinguish relevant from accessory information (simplification process). Like with any other career, becoming an information designer doesn’t take place overnight; exercises like this are only the very first step into the journey. As Nigel Cross points out, a great part of design education is learning how to organise stored knowledge in a way that it can be accessed and retrieved when needed (e.g. when working on a specific project); aspect of design education which is frequently forgotten.
In other words, becoming an information designer involves both understanding theories, methods, way of thinking, principles, and practice, loads of practice!
—
Cross, N. (1982) Designerly ways of knowing. Design Studies, 3(4), 221–227.
Leave a Reply