Each person experiences writing is a different way: while for some people writing comes naturally and words flow one after the others for others writing can take more time and be a harder journey. But, in general, when it is part of an extensive project, like a book or thesis, the writing process can be particularly challenging, not only for the large amount of words, but for the need of systemic approach to make connections clear throughout the chapters. Looking back at my new book–Making Sense of Field Research: A Practical Guide for Information Designers—the use of information design was essential to navigate and structure the process from beginning to end.
In this post, I share some reflections and learnings that may be helpful to anyone going through a similar experience. The following are six main tasks that I identified from my writing process (some of which occurred in parallel) where the use of information design mindset and skills came extremely handy to move forward.
1. Organising ideas
This first step may sound obvious but determining what to write, and where to find the information to inform my writing seemed at the beginning like a huge roadblock (there is so much already out there!). Creating a road map was to me an initial key step. Particularly, seeing my ideas thematically organised as a table of contents helped me better understand what topics should be introduced together or first, how topics were connected to each other, and think about the book holistically. The road map took different formats as I was adding granularity and details. For example, I created:
- many tables of contents as a simple word document
- more visual tables of contents using post-its
- many more rough sketches to illustrate ideas and connections between topics
2. Organising content and sources
The more you search, the more you find, the more ideas you have; the more you read, the more connections you make, and more ideas emerge. This cycle repeated so many times that this was quite a long step. I spent considerable amount of time researching, reading papers, books, blog posts, and talking to people, not only at the beginning but throughout the whole process. This was great; but in a week I had more than 100 files and a desk full of book piles. To make sense of all this content and facilitate accessing each source when I needed it, I heavily relied on information design principles:
- I organised sources thematically
- used colour coding to highlight specific parts of each source
- used index cards to extract key concepts, indicating source and author
- created digital files using other organising principles (e.g. authors, date)
3. Understanding first
As Weik (1993) pointed out, the more you know about something, the harder it can be to explain that something in a simple way; but not a simplistic one. To achieve the former and not the latter, before writing anything, I made sure to first fully understand each concept, or step of a process, or why something should be done in a particular way. A great way to test whether my explanation was clear and simple was sharing with and playing back my understanding to people unfamiliar with the material. Students, friends and family can be great help.
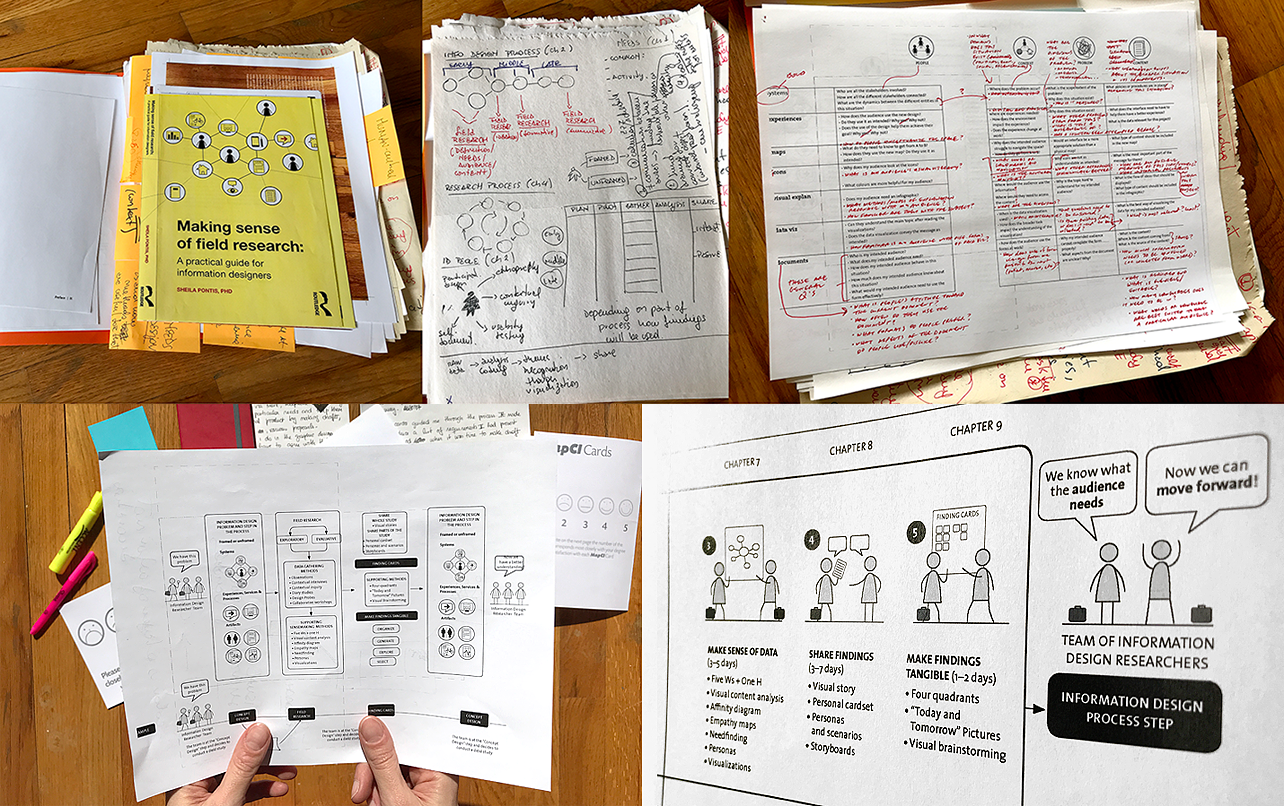
4. Visualising my understanding
This was another key step for me. Part of my understanding process involved the creation of rough sketches and abstract diagrams. These visuals were extremely useful to help me think and clarify sequences of ideas and tasks, connections and hierarchies; these were mostly done by hand. A few examples are shown in the above figure.
5. Creating visualizations
Some of the rough visuals made their way to the book too. This process was sometimes longer than expected, because it involved many iterations and testing; each of them truly necessary. One thing is to create sketches to help you understand something. Another thing is to make those sketches clear enough to communicate that same understanding to someone else without you having to explain them. For example, the book includes visual explanations of:
- the sensemaking process
- the field research process
- how to plan and conduct a field research study in information design
- how to use research findings in the information design process
6. Designing the book. When I was close to submit the final manuscript I realised that due to large number of visuals, it was going to be “easier” to design the book myself than to tell someone else where to place each figure and table. In retrospective, this was a fun; although it demanded all my editorial design skills: definition of clear guidelines before starting the layout, great attention to detail and consistency.
In short, using my information design hat allowed me to have a more holistic view of the process, a better sense of those steps that I have completed and those that I still needed to work on, but most importantly, helped me articulate and communicate concepts with more clarity.
—
Making Sense of Field Research: A Practical Guide for Information Designers is available from Routledge and Amazon.
—
Weik, K.E. (1993) Sensemaking in organizations: Small structures with large consequences. (Murnighan, K.j., Ed.) In: Social Psychology in Organizations, Chapter 2.
Leave a Reply