Next month, I will be facilitating a workshop on the intersection of field research and information design at the forthcoming Design Educators Research Conference (Decipher) conference organised by AIGA Design Educators Community and the new DARIA Network (Design as Research in the Americas). This will be a hands-on design research conference including activity groups, workshops and conversations. Each will focus on addressing how to define, do, disseminate, support, and teach design research.
What’s the workshop about?
As the need to understand people’s contexts and behaviors has become an essential step in the design process to create successful solutions, the need for adding design research as a skill set has significantly grown amongst designers. However, conducting research that involves actual contact with intended audiences, such as talking to people, and analysing that research data seems intimidating, time-consuming, and expensive.
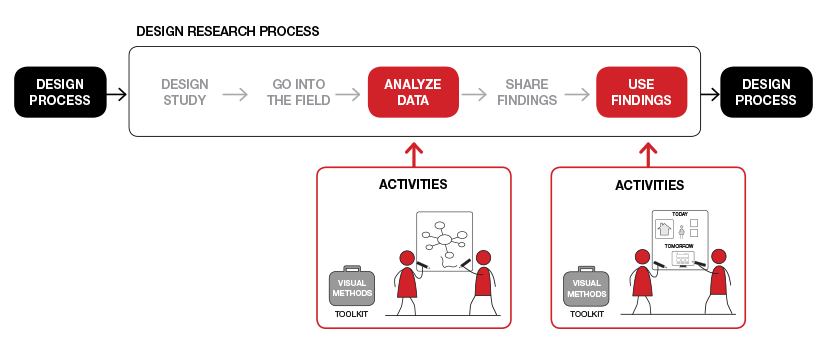
To address common barriers, this workshop aims to encourage the use of field research (e.g. contextual interviews or participant observations) in professional practice, and the use of visualisation methods to support the analysis of field data. Working with visualisation methods can help see hidden connections in the data and articulate ideas in a clearer way. Some of these methods have been tried and tested before, but they aren’t often approached through an information design lens. The set of visualisation methods that we will work with in this hands-on workshop are rooted in the disciplined logic and visual principles of information design. Specifically, we will focus on supporting two key steps of the research process:
- making sense of research data
- moving from findings to actionable items to inform the design process.
These two steps are often challenging, but they can be even more overwhelming when working with field data because this type of data is often unstructured representing participants’ stories, feelings, expressions, gestures, or behaviors. Making sense of this type of data and determining how to use it to support design decisions is often a major barrier for designers. Through a series of activities, the workshop will help gain confidence externalizing and visualizing the thinking process, while making sense of data.
Some of these visualisation methods and frameworks (e.g. 5Ws+1H and empathy maps) are also discussed in my recent book: Making sense of field research: A practical guide for information designers.
Who is the workshop for?
Whether you are a (graphic, service, website, interactive, etc.) designer wanting to learn more about how to make sense of field research data or a researcher wanting to learn how to use design principles to enhance your research skills, you will benefit from this workshop. The workshop is also open to both experts and novices, and no drawing experience is required. However, openness, willingness to learn, participate and explore will be a must! Working with field research isn’t hard; but like any new skill it does require work and practice to do it with the necessary rigour to arrive to valuable results.
If you are interested in learning more about how to use field research in your practice join the conference and come to the workshop! This will also be a great opportunity to learn more about the role of design research in professional practice and experience three days with design practitioners and researchers bridging theory and practice.
- Design Educators Research Conference (Decipher) – 27-29 September 2018 | This workshop is on the morning of Saturday 29th.
Leave a Reply