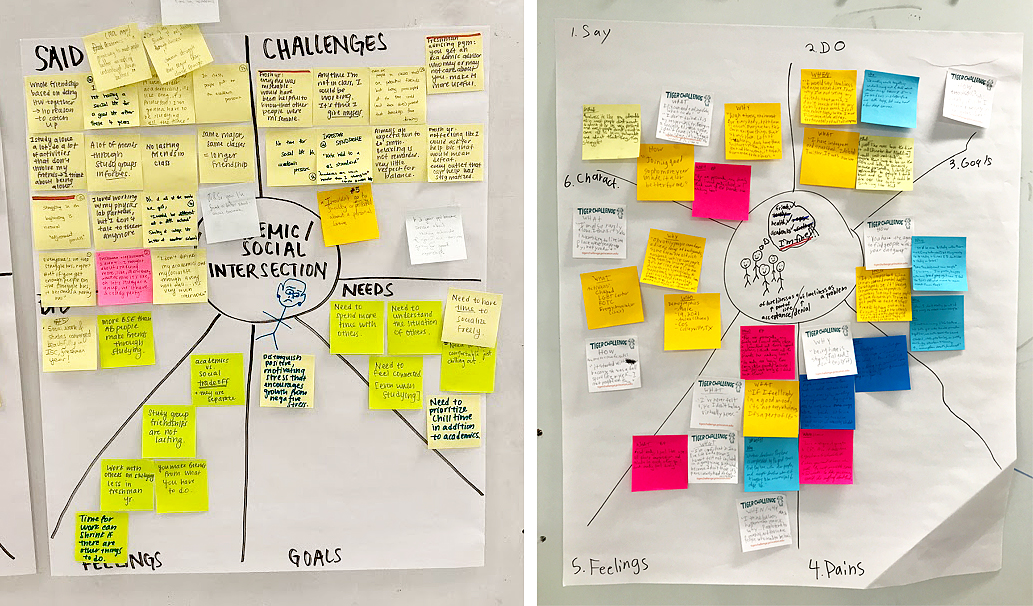
Figure 1: Empathy maps created to synthesize coded data. Data was not color-coded or coded in any visual way which makes it hard to identify the origin of each excerpt or identify trends across categories. [Created by EGR200 students – Fall 2018]Design education provides the theoretical foundation to understand why a design solution can be effective and why another solution is most likely to be misleading. This knowledge helps designers use design principles and visual skills with intention and in a deliberate way in any situation For example, rather than using colors at random to code information or organise content, a designer would take a moment to choose an appropriate set of colors (e.g. very different from each other) that would allow them to work with a functional approach.
This way of thinking may seem simple or banal, however it indicates a core difference in how designers and non-designers engage in problem-solving tasks. Knowing how to use specialised software, like Adobe InDesign or Illustrator, or working with a design technique doesn’t make a person a designer. This is particularly notorious in the use of design thinking among non-designers. Frequently, people who work with the design thinking process are fond of the use of post-its. However, the use of post-its does not indicate an understanding of the process or guarantee an effective use of a technique. Using post-its in a deliberate way takes awareness, intention and practice, but helps reveal connections and patterns that otherwise would be hidden. One way to exemplify this mindset is when a person creates “coding rules” to purposefully color-code information and then uses consistently throughout the lifecycle of a project or at least while working with a same technique.
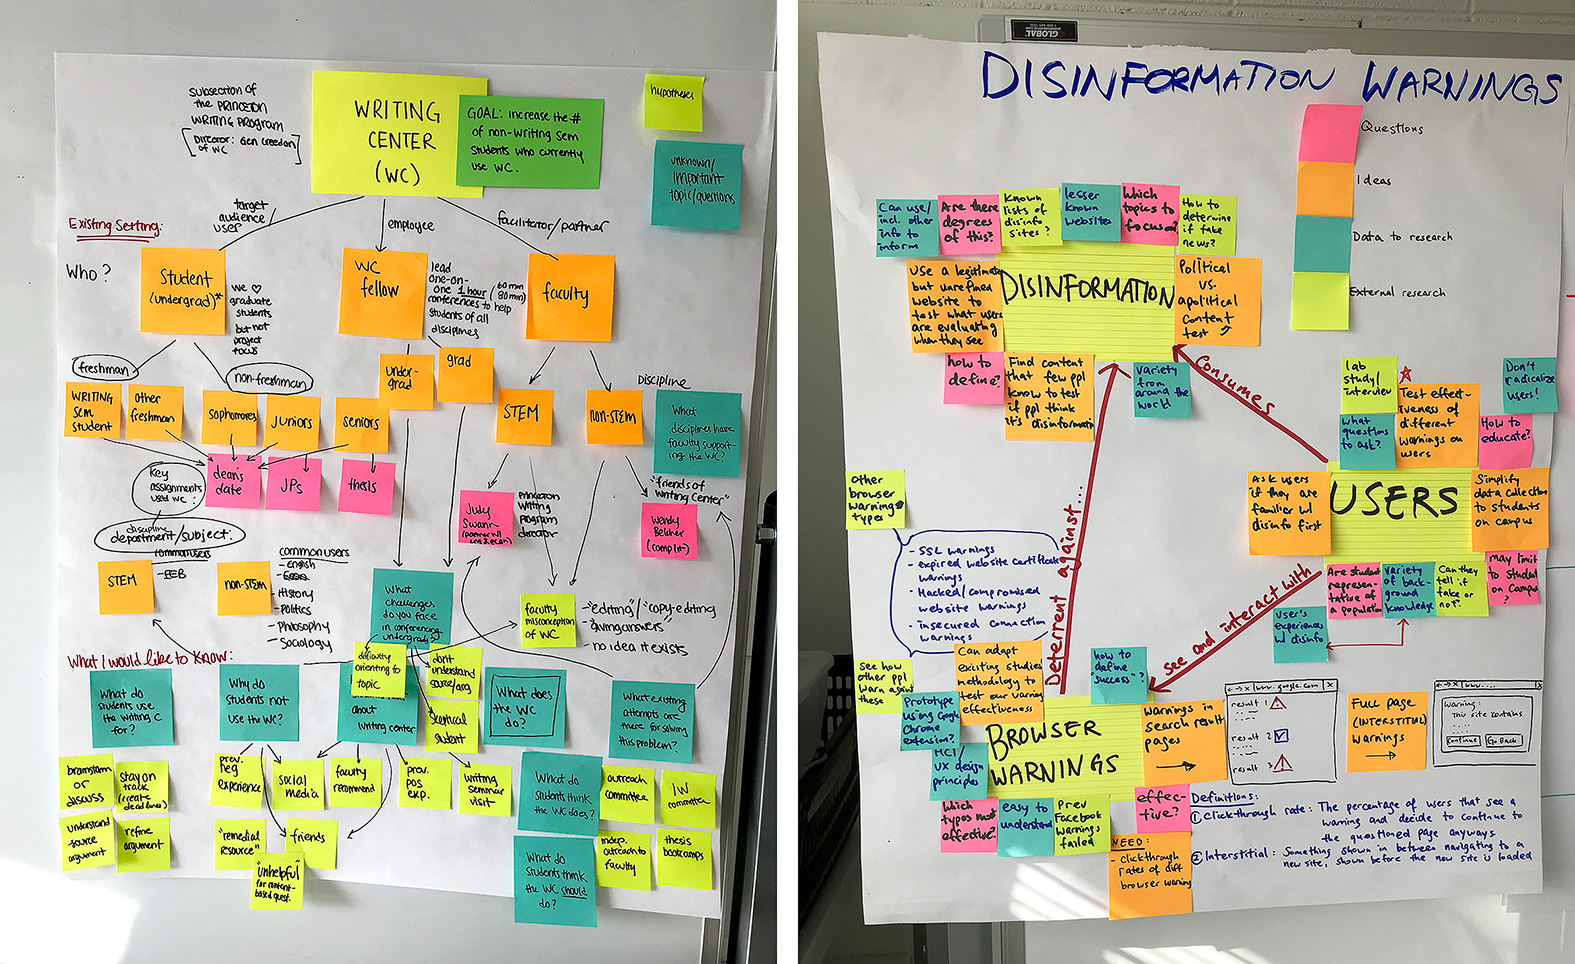
Figure 2: Concept maps created to visualize current problem situations. Information is color-coded by topic and type. For example, on the left map, the students is coding information with color and size. On the right image, pink post-its represent questions, orange post-its represent ideas, and blue and yellow post-its represent different types of data the student needs to research. [Created by EGR487 students – Spring 2019]
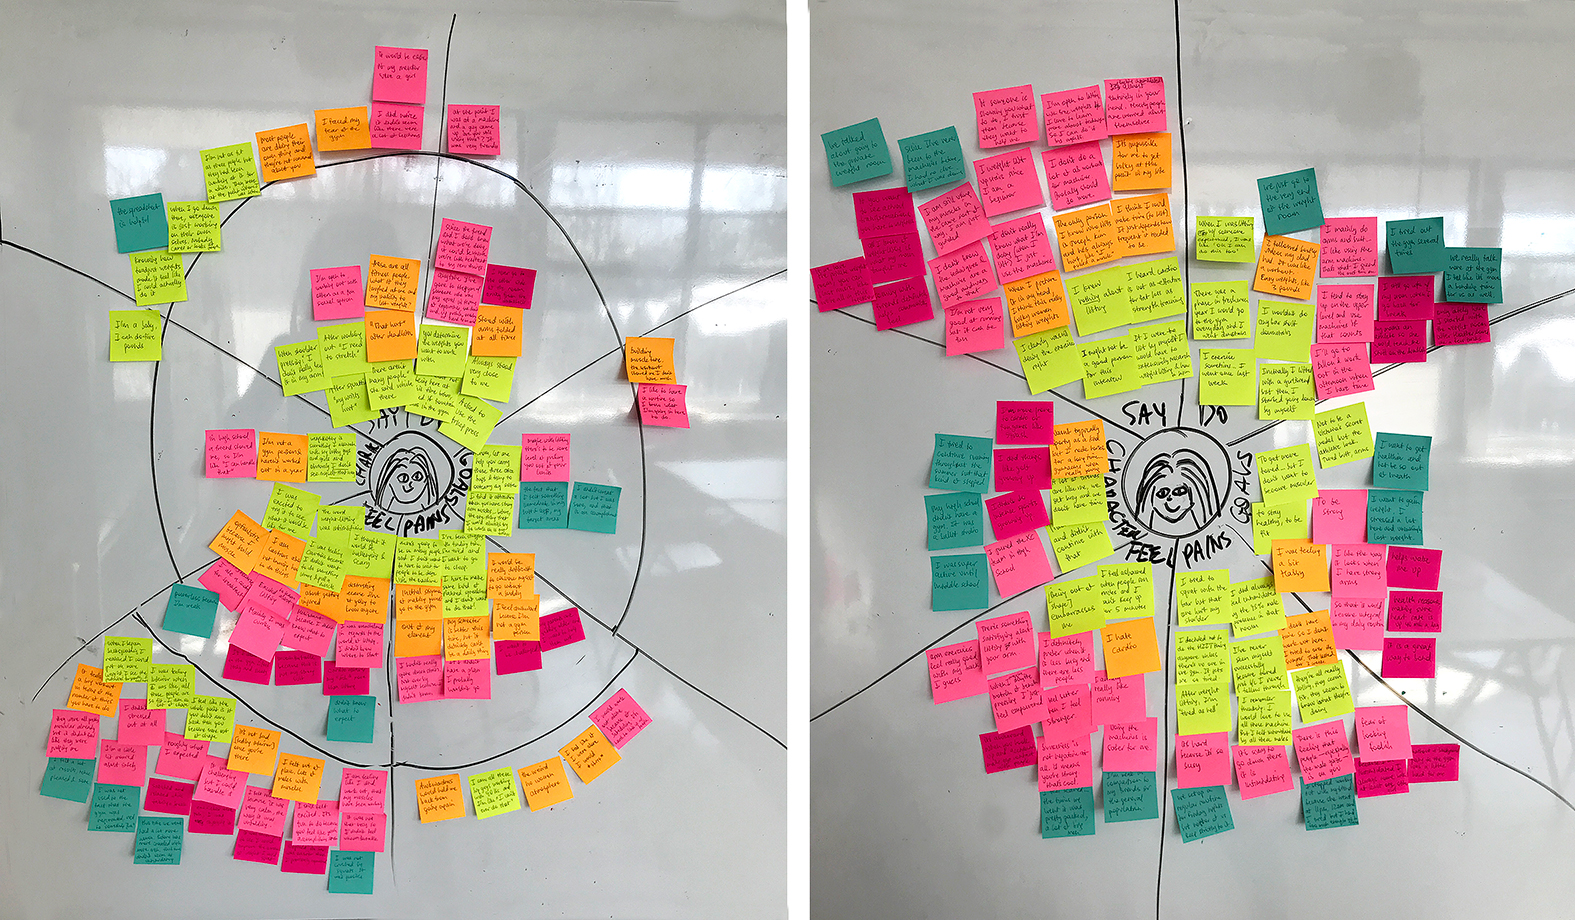
Figure 3: Empathy maps created to synthesize coded data. Data gathered from each participant. was color coded and then allocated to the respective category. As each color represent a different participant, at a glance it is easy to see that the sample size was of five participants, and which of them did not provide insights for all categories. [Created by EGR487 student – Spring 2019]Figure 1, at the top of this post, was created to analyze research data but with no intentional use of post-its or coding rules in mind. In contrast, Figures 2 and 3, also created to analyze research data and map problem situations but by students from the advanced design thinking class I have created and started teaching at Princeton University this semester, show awareness, clear intent and consistent use of coding rules. In other words, these images show that these students have understood how designers think and started to apply the pillars of design: understanding, intention, and consistency.
Learning design tools is only a small part of becoming a designer. Learning and applying the designmindset and way of working is what makes someone be a designer.
[…] the techniques that best support your needs is the first step. What it matters is using them in a systematic and deliberate way to look for connections, relationships and […]
Leave a Reply